Output Restriction
Module: tutorials.05_pre_post_processing.04_output_restriction.run
Section author: Gernot Plank <gernot.plank@medunigraz.at> and Anton J Prassl <anton.prassl@medunigraz.at>
Introduction
Large models produce a large amount of data in every simulation run. The size of such datasets renders download of data and their analysis is a time consuming endeavor. Often outputs are only of interest at a much lower spatial resolution relative to what is used internally for computations, or, data are even only of interest at a very small number of observation sites. In such scenarios it is handy to restrict output to a small number of nodes, thus facilitating fast data download and easy analysis.
Problem Setup
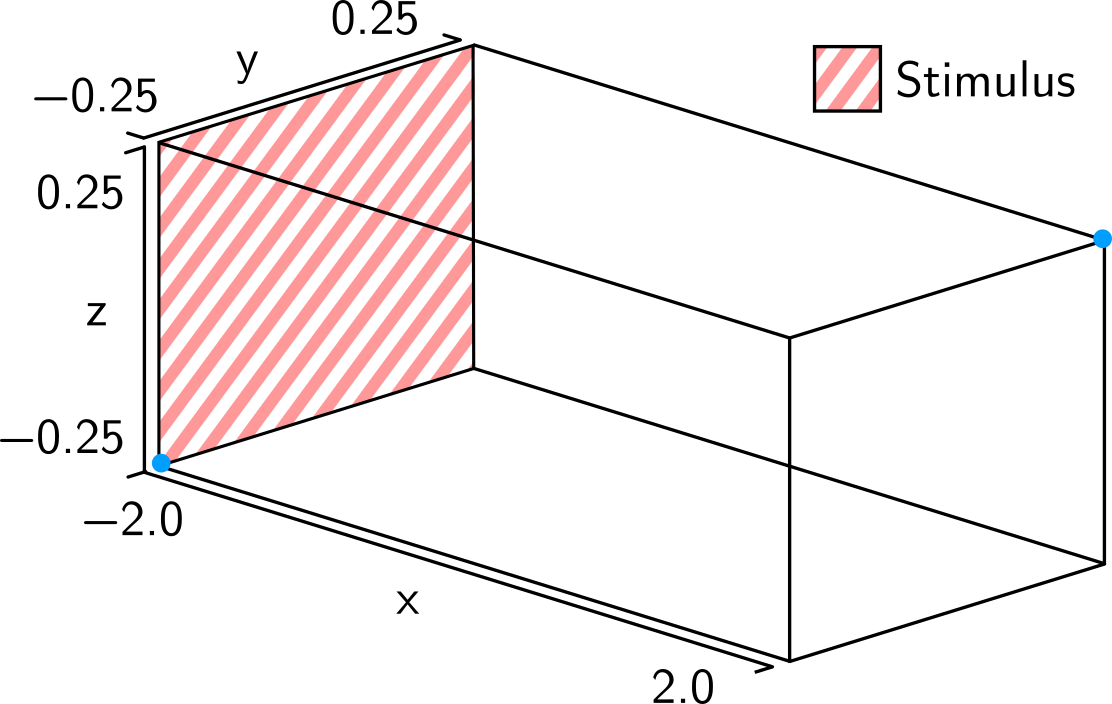
This example defines a small cuboid on the domain:

Problem-specific CARPentry Parameters
Output of spatial data can be restricted using
-iout_idx_file fileA.vtx
-eout_idx_file fileB.vtx
The file format of vertex files is given in Vertex file.
Experiments
To run these experiments
cd tutorials/05_pre_post_processing/04_output_restriction
Run
./run.py --help
to see all exposed experimental parameters
--tend TEND           Duration of simulation (ms)
--show-full           To turn off output restriction in this tutorial.
Experiment exp01
In this experiment, we reduce output on intracellular grid. By default the first and the last node of the block are taken.
Run
./run.py --dry
to see the parameters used for this experiment.
To launch the experiment, type
./run.py --visualize
Note
The file specifying the subset of output nodes is autogenerated and stored in the tutorial’s temporary meshes folder - see /meshes/…/iout_indices.vtx.
Note
The user may convert the reduced output file, e.g. vm.igb, into a more readable ASCII file by
cd <simID>
igbextract vm.igb -o asciiTm -O vm.dat
Note
Meshfiles generated using -gridout_i or -gridout_e still relate to the unrestricted intracellular and/or extracellular grids and thus will typically not be compatible with the igb output. This experiment autogenerates a new points file copying over the first and last node of the source mesh!
Experiment exp02
This experiment is intended for comparison to the data generated in exp01.
Output restriction is turned off. You may inspect nodal Vm-traces of node ‘0’ and
node ‘1475’ within meshalyzer. To do so, click on ‘Time series’ in the main window.
Then select the vertex of interest in the input field right above.
./run.py --show-full --visualize

 face.
Two locations used for output restriction are marked with blue dots.