Augmentation and Pseudo-bidomain
Module: tutorials.02_EP_tissue.07A_augmentation.run
Section author: Gernot Plank <gernot.plank@medunigraz.at>, Anton Prassl <anton.prassl@medunigraz.at>
Bath Loading
In vivo, but also under all common in vitro experimental conditions, cardiac tissue is surrounded by conducting fluid. In vivo its blood at the endocardial surfaces and pericardial fluid at the epicardial surface. In experimental preparations tissue is perfused or superfused with Tyrode’s solution. These surrounding fluid layers act to increase conduction velocity close to the tissue-bath interface by reducing the resistance of the interstitial current pathways as local circuit currents are shunted through the bath domain where conductivity is higher. Thus depolarization wavefronts propagating in the vicinity of the tissue-bath interface move faster than those in deeper layer of tissue, thus inducing transmural wavefront curvature. This effect is referred to as bath-loading. To account for bath loading in a computer model, in general, a full bidomain formulation is needed which is computationally expensive.
Augmentation
Bidomain theory explicitly considers current flow in both intra- and extracellular domains, and thus allows modeling of current flow and potential fields in the bath surrounding tissue. In spite of the knowledge that bath loading modulates wavefront morphologies close to the tissue-bath interface, the vast majority of simulation studies use the monodomain approximation. Monodomain models in a standard implementation are not able to account for bath loading effects, but are roughly ~10x faster to compute than a bidomain model. Thus in most computational model studies the monodomain model has been preferred. However, using a technique referred to as augmentation bath loading effects can be taken into account even when using a monodomain model. Briefly, the idea is to account for the lower interstitial resistance close to the tissue bath interface, mediated by the lower resistance of the adjacent bath which shunts extracellular currents of local circuits away from the interstitial current path, by using higher bath conducitivies within a thin layer along the tissue bath interface. The width of this thin layer, referred to as augmentation layer, and the bath conductivy introduce a bath loading effects very much comparable to those observed in full bidomain models. Details on augmentation are found in the literature where it has been demonstrated that augmented monodomain models faithfully replicate bath loading effects with high fidelity, comparable to full bidomain simulation results. For details see the studies by Bishop et al. [1].
Pseudo-bidomain
In addition to using augmentation as a method for improving the representation of electrical sources
the effect of bath loading upon extracellular electrograms can be studied by using a pseudo-bidomain approach.
The pseudo-bidomain model as opposed to a full bidomain model is attractive
as it offers significant computational savings while providing a very close approximation
(depending on how close the source distribution of the full bidomain model can be approximated by augmentation)
of a full bidomain solution with regard to extracellular potential fields.
The pseudo-bidomain in terms of computation is essentially a monodomain solve with infrequent elliptic solves
to recover the extracellular potential field  with appropriate adjustments of
conductivity tensors. Details on the pseudo-bidomain approach are found again in Bishop et al [1].
with appropriate adjustments of
conductivity tensors. Details on the pseudo-bidomain approach are found again in Bishop et al [1].
This tutorial peruses to highlight all relevant carpentry parameters needed and applied to a slab-like geometry.
Experimental Setup
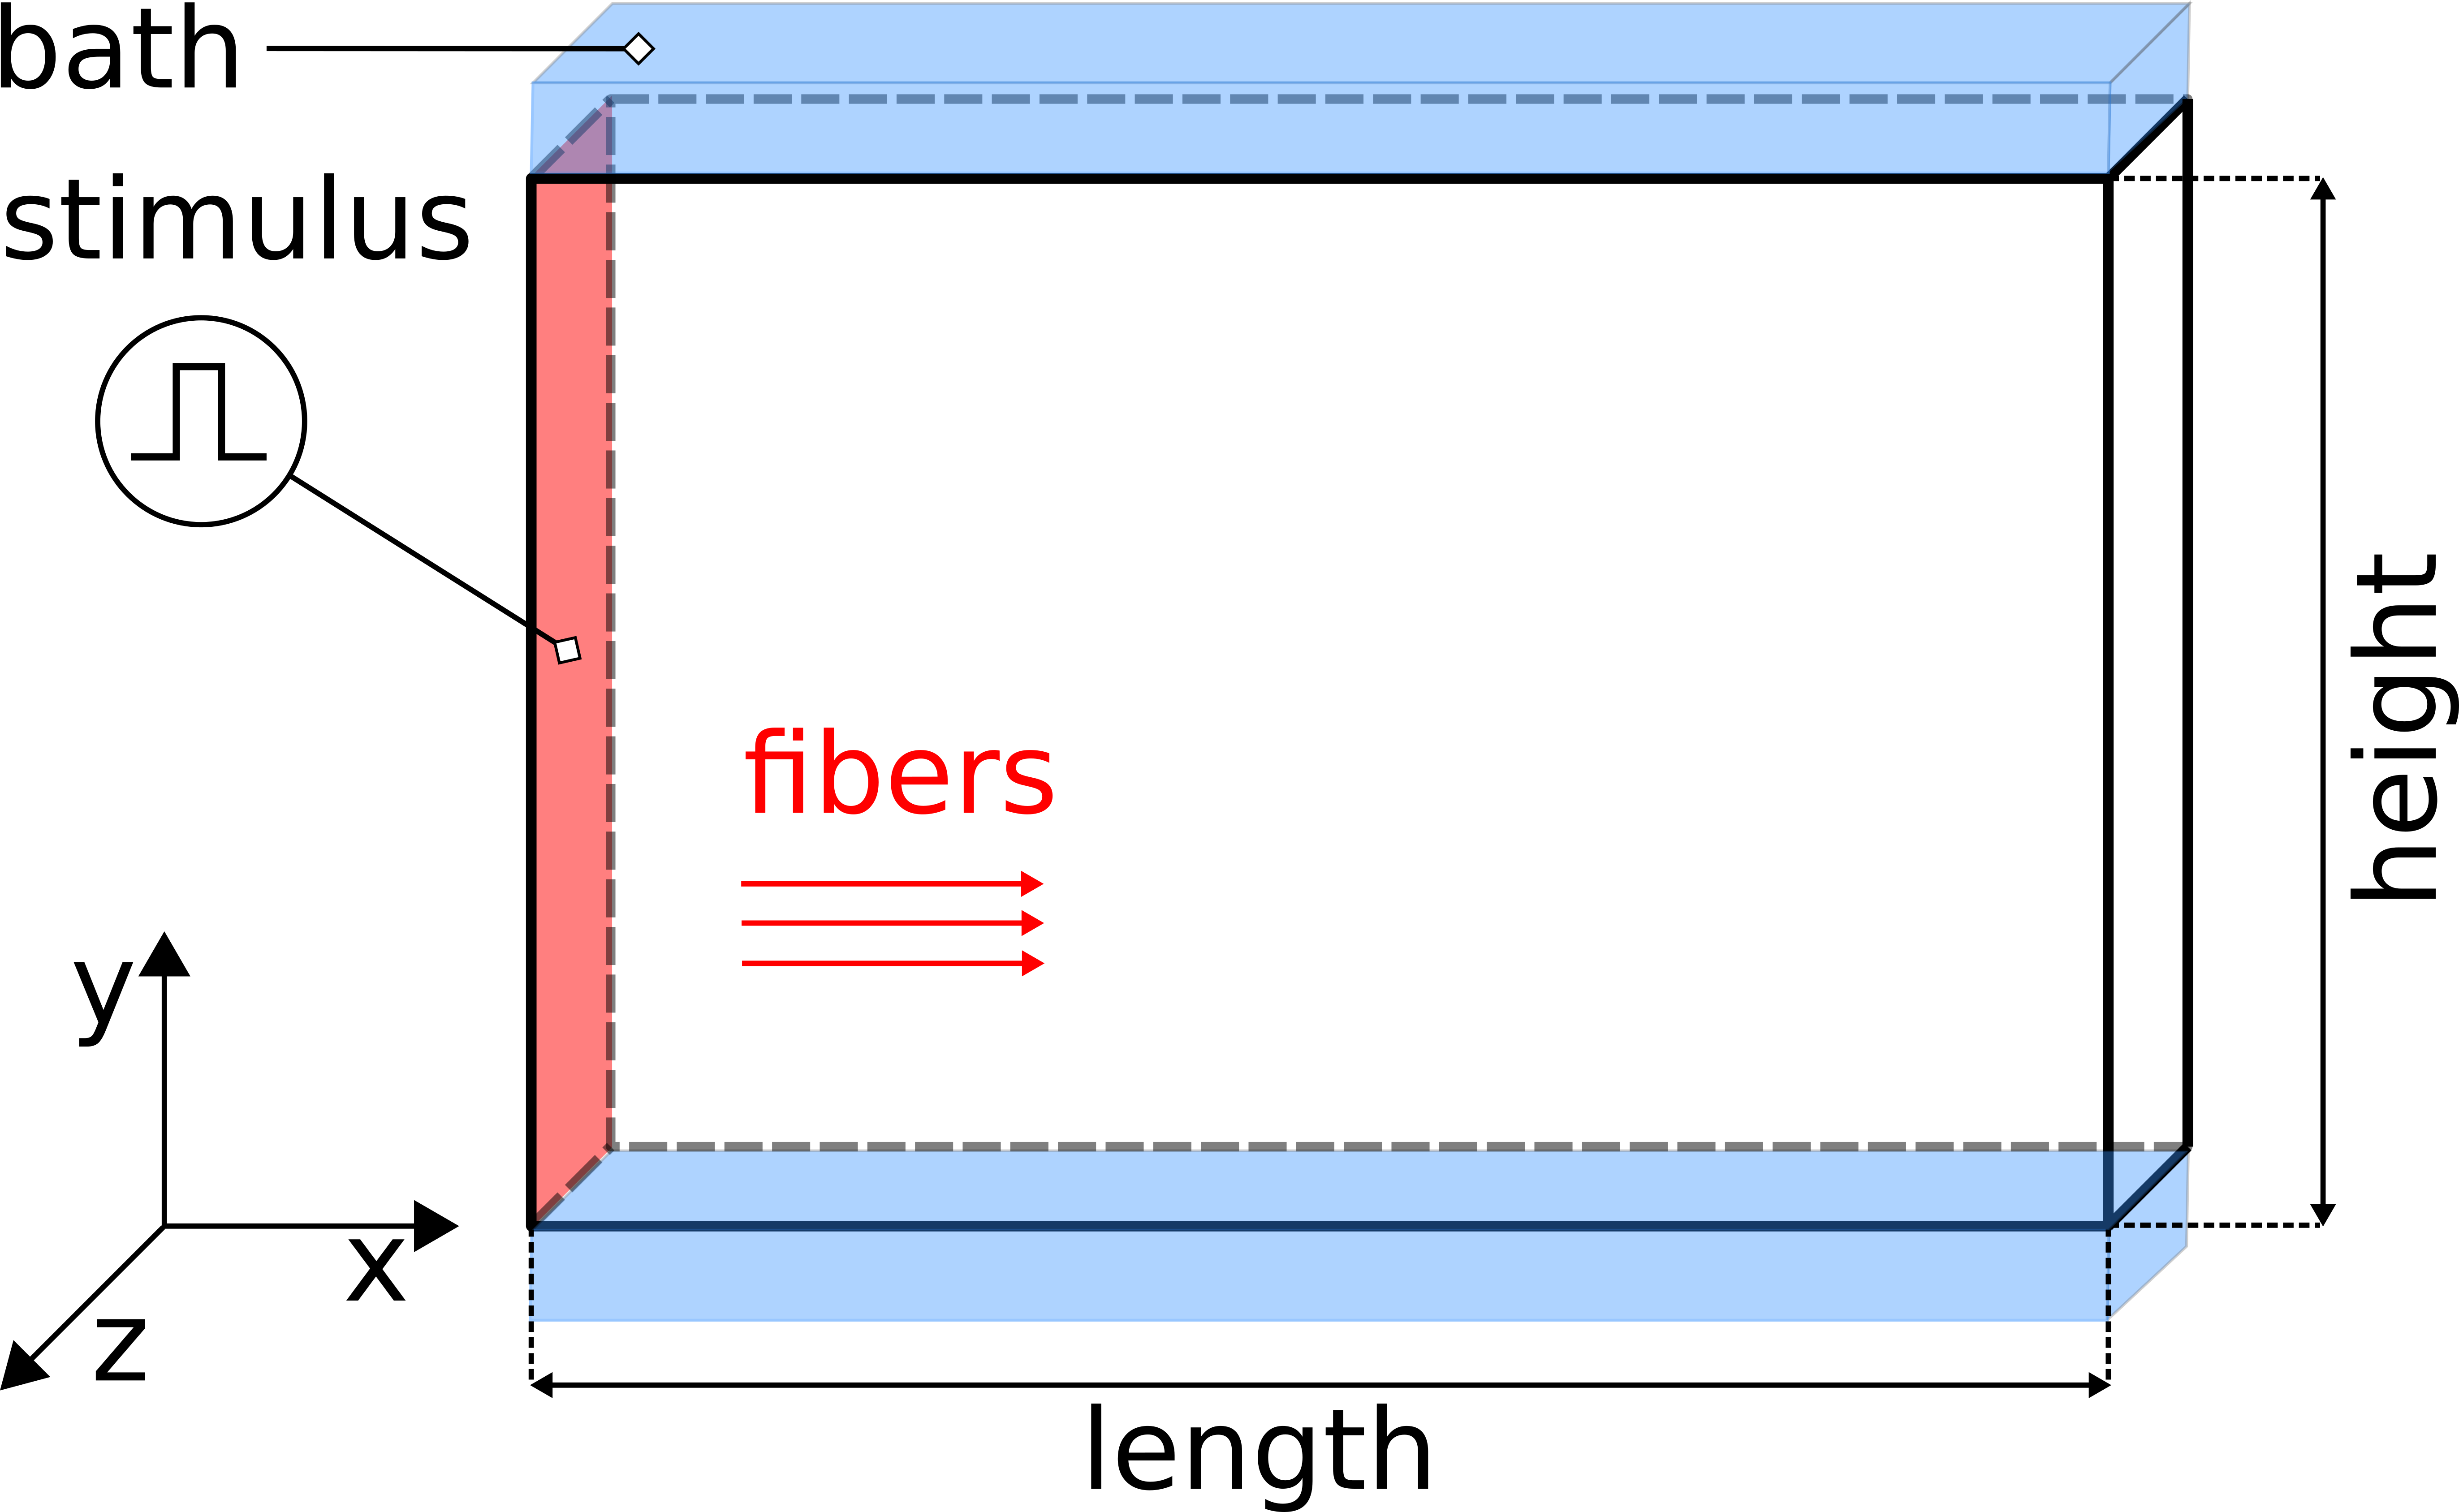
Fig. 98 The setup uses a regular tetrahedral FE model, representing a 3-D slab of myocardial tissue with dimensions 1.50cm x 0.01cm x 1.00 cm (l,w,h) in the x-, y, and z-directions stimulated at the left front side. A conductive bath is attached along the +y and -y faces of the wedge, thus forming a tissue bath interface along which bath loading effects will occur.
Experiments
The below defined experiments demonstrate the wave front differences when choosing different electrical source models. To run these experiments
cd ${TUTORIALS}/02_EP_tissue/07A_augmentation
Run
./run.py --help
to see all exposed experimental parameters
--sourceModel     Pick type of electrical source model {monodomain,bidomain,pseudo_bidomain}
--tend TEND       Duration of simulation (ms)
--depth DEPTH     Depth of augmentation layer (um)
--conductivities  roberts82, roberts79 or clerc77
These parameters translate into CARPentry input parameters as follows:
bidomain          2              # source model, either monodomain, bidomain or pseudo-bidomain
augment_depth   200.0            # depth of the augmentation layer in :math:`\mu m`

num_gregions      1
gregion[0].name   roberts82      # tissue conductivities according to Roberts and Scher in 1982
gregion[0].g_il   0.34
gregion[0].g_it   0.06
gregion[0].g_in   0.06
gregion[0].g_el   0.12
gregion[0].g_et   0.08
gregion[0].g_en   0.08

gregion[0].name   roberts79      # tissue conductivities according to Roberts and Scher in 1979
gregion[0].g_il   0.28
gregion[0].g_it   0.026
gregion[0].g_in   0.026
gregion[0].g_el   0.22
gregion[0].g_et   0.13
gregion[0].g_en   0.13

gregion[0].name   clerc77        # tissue conductivities according to Clerc in 1976 [#clerc76]_
gregion[0].g_il   0.174
gregion[0].g_it   0.019
gregion[0].g_in   0.019
gregion[0].g_el   0.625
gregion[0].g_et   0.236
gregion[0].g_en   0.236
The conductivities used are based on the experimental studies of Clerc [2], Roberts, Hersh and Scher [3] and Roberts and Scher [4].
Note that these early studies were not aware of the existence of sheets in cardiac tissue. Thus rotational isotropy was assumed, that is, transverse conductivities within sheets and sheet normal conductivities were assumed to be identical.
Experiment exp01
In this experiment, we stimulate a slab as shown in Fig. 98 using a full bidomain formulation. Due to the stark difference in conductivity between interstitial space and bath a pronounced bath loading effect is witnessed.
./run.py --sourceModel bidomain --depth 0 --tend 10 --visualize
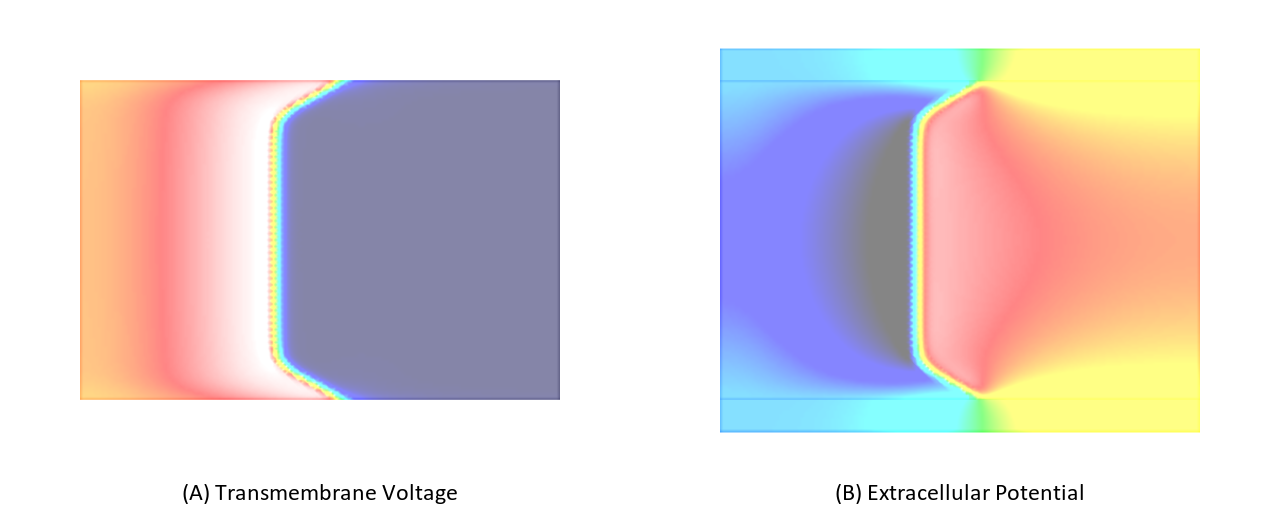
Fig. 99 Due to the pronounced differences in conductivities between interstitial fluid and bath a pronounced bath loading effect is observed.
Experiment exp02
Now we repeat exp01 using a monodomain formulation. In this case no bath loading effects are observed as bath loading is mediated by the potential field in the extracellular medium which is not taken into account by the monodomain model. the electric field loading effect is witnessed.
./run.py --sourceModel monodomain --depth 0 --tend 10 --visualize
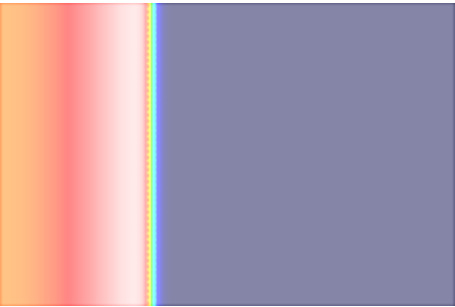
Fig. 100 Since the extracellular potential field is ignored in a monodomain formulation no bath loading effects can be observed.
Experiment exp03
The effect of bath loading can be mimicked by increaseing the conductivity of the intracellular space in a thin tissue layer adjacent to the tissue bath interface. Typically, this is achieved by setting the interstitial conductivity equal to the extracellular bath conductivity. The choice of the bath conductivity in combination with the depth of the augmentation layer modulate the bath loading effect. Using this technique which has been published by Bishop et al in [1] and is referred to as augmentation bath loading can be taken into account without using the computationally much more expensive bidomain formulation.
In this experiment a monodomain formulation is used. A layer of 200  depth will be used for augmentation,
that is, within this layer the interstitital conductivites are set to the bath conductivity.
depth will be used for augmentation,
that is, within this layer the interstitital conductivites are set to the bath conductivity.
./run.py --sourceModel monodomain --depth 200 --tend 10 --visualize
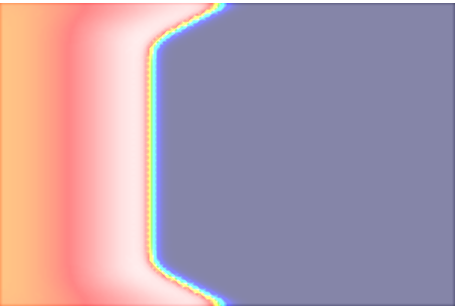
Fig. 101 Despite using a monodomain formulation a bath loading effect is clearly visible. This is achieved by augmentation of superficial tissue layers.
Experiment exp04
Same setup as above, but choosing the bidomain approximation.
./run.py --sourceModel pseudo_bidomain --depth 200 --tend 10 --visualize
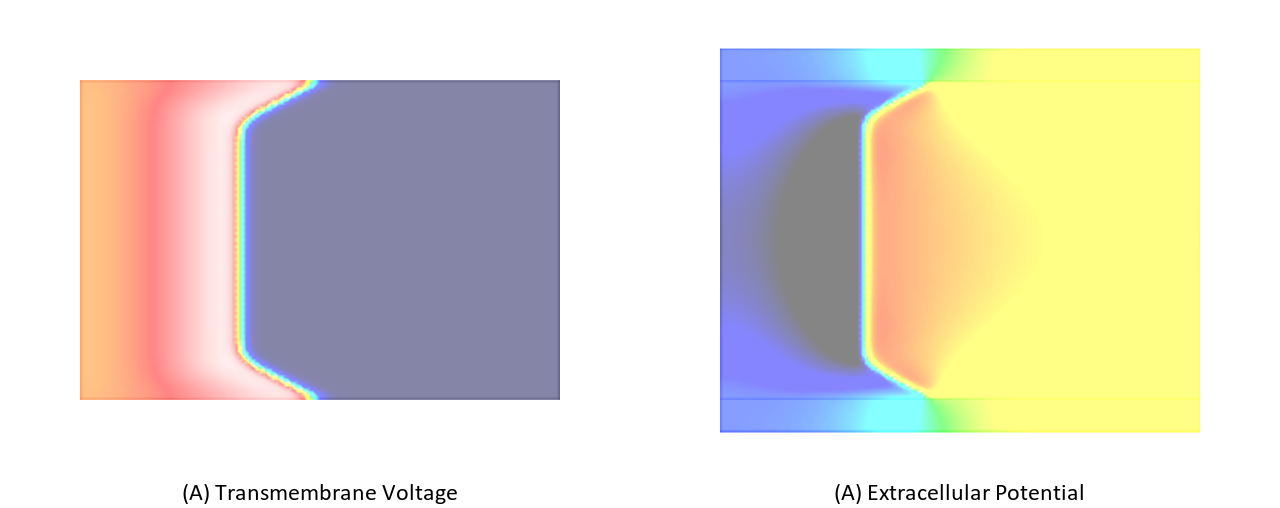
Fig. 102 Similar to exp04, in the pseudo-bidomain the source is represented by an augmented monodomain model to account for bath loading (A). Extracellular potentials shown in (B) are computed then infrequently at the given temporal output granularity.
Experiment exp05
As shown in [1], bath loading effects are mainly governed by the ratio between interstitial conductivity along the direction of propagation of a depolarization wavefront and the isotropic bath conductivity. This is easiy exmemplified by comparing the differences in bath loading effects when using the Clerc or Roberts conductivities.
To illustrate this effect repeat the simulation in exp04 using the conductivities measured by Clerc. A comparison between these two cases is shown in Fig. 103.
./run.py --sourceModel pseudo_bidomain --depth 200 --tend 10 --conductivities clerc76 --visualize
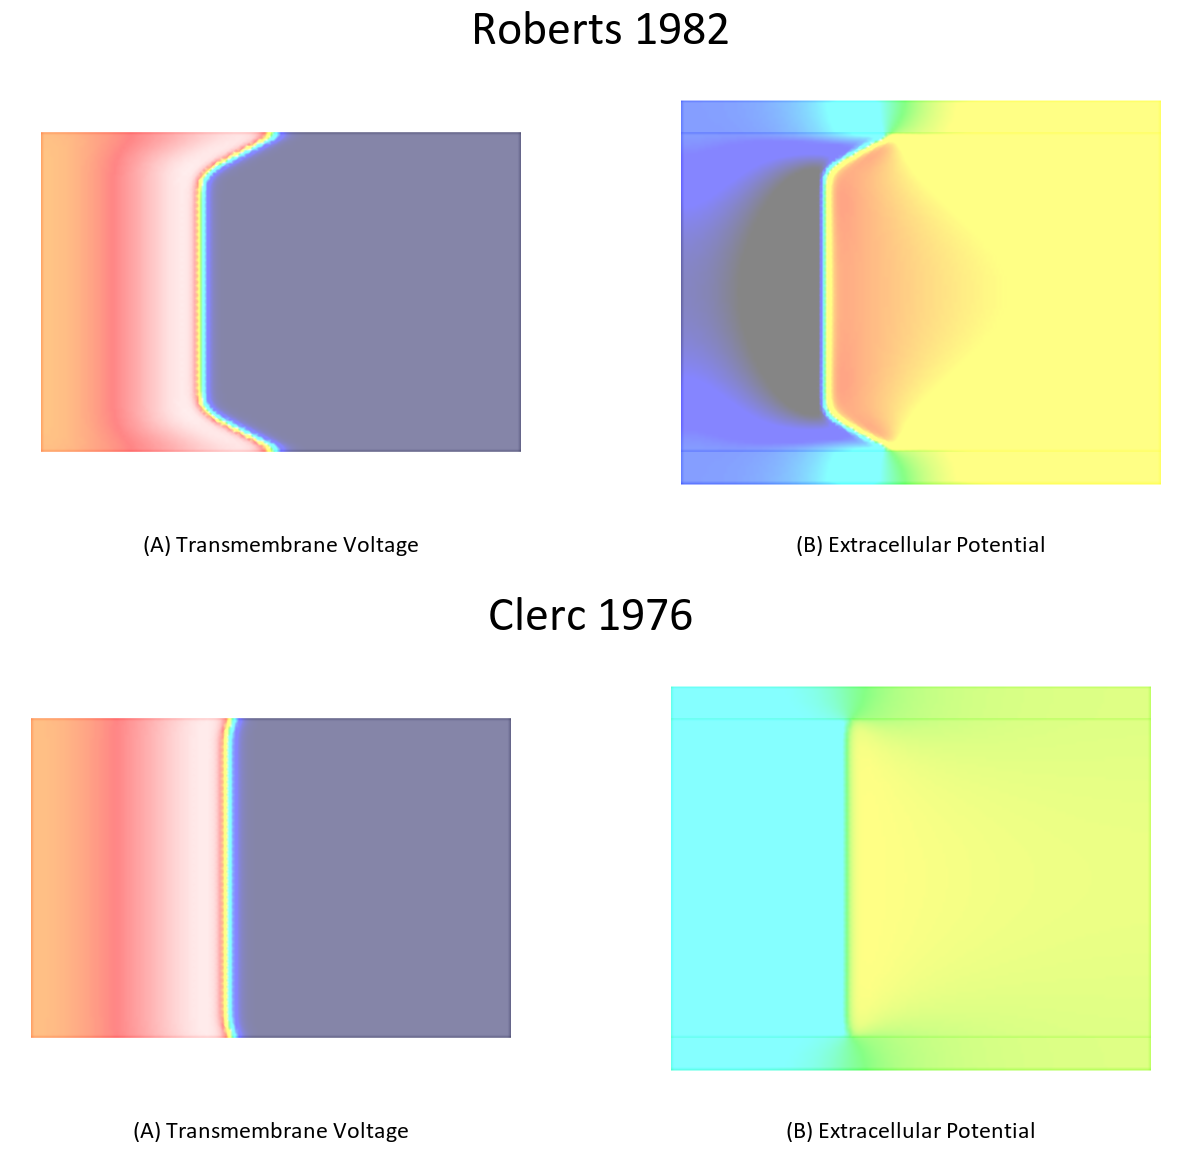
Fig. 103 Differences in bath loading when using either the conductivity values of Clerc [2] or Roberts [4]. Notice the much stronger bath loading effect, as evidenced by the V-shape of the wavefront close to the tissue bath interface, in the Roberts case. Using the Clerc conductivities the interstitial longitudinal conductivity of 0.625 S/m is almost as high as the bath conductivity.
- VERIFY
- that the setup is inducing wavefront curvature in pseudo-bidomain (and bidomain) mode
- the gain in time between the pseudo-bidomain and ‘pure’ bidomain approximation
[CHEAT MODE] pseudo-bidomain
bidomain
monodomain
References
| [1] | (1, 2, 3, 4) Bishop MJ, Plank G. Representing Cardiac Bidomain Bath-Loading Effects by an Augmented Monodomain Approach: Application to Complex Ventricular Models, IEEE Trans BioMed Eng. 58(4):1066-75, 2011. [PubMed] |
| [2] | (1, 2) Clerc L. Directional differences of impulse spread in trabecular muscle from mammalian heart., J Physiol. 255(2):335-346, 1976. J Physiol. 255(2):335-346, 1976. [PubMed] |
| [3] | Roberts DE, Hersh LT, Scher AM. Influence of cardiac fiber orientation on wavefront voltage, conduction velocity, and tissue resistivity in the dog. Circ Res. 44(5):701-12, 1979. [PubMed] |
| [4] | (1, 2) Roberts DE, Scher AM. Effect of tissue anisotropy on extracellular potential fields in canine myocardium in situ., Circ Res. 50(3):342-51, 1982. [PubMed] |